
Platform
Backlink reporting dashboard tied to every approval record
Log live URLs, anchors, referring domains and indexation status beside optional analytics signals. Export clean summaries for monthly business reviews without rebuilding spreadsheets.
The problem with link lists disconnected from outcomes
Teams often receive monthly CSV attachments that list URLs without tying them back to who approved each placement, which target page was prioritised or whether links remain indexed months later. Leadership asks whether spend moved the pages that matter; SEO spends hours merging vendor exports with Search Console and analytics before every review. Agencies rebuild client decks manually, risking version mismatches between internal and external narratives. Audits stall because nobody can reconstruct decisions from a flat file.
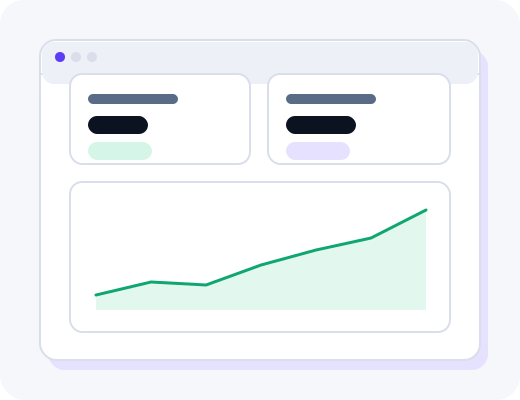
The backlink reporting dashboard keeps placement records, approval history and live verification results in one view. Optional connections to analytics and Search Console properties you authorise add referral and landing-page context beside link-level data. Exports inherit the same fields visible in the product—nothing hidden behind a separate upsell—so finance and client stakeholders read a consistent story.
How reporting data is collected
When order tracking completes live verification, the placement moves into reporting automatically with final URL, anchor text, link attribute, referring domain, placement type and indexation check results where applicable. The record retains ties to the approval timestamp and any comments attached during sign-off, which supports compliance reviews in regulated verticals without opening multiple tools.
If you enable SEO tool integrations, read-only signals such as referral paths or query coverage can sit beside placement rows for the properties you scope. Disconnected integrations fall back to link-level reporting without breaking historical records. Rank and traffic overlays are observational over time—we document what the dashboard shows, not promised ranking outcomes.
What you see in the dashboard
Default views list live placements with filters by workspace, domain group, campaign tag, date range or target section on your site. Summary tiles highlight new links in period, replacements processed and credits delivered versus committed. Drill-down rows show publisher context, vetting band and whether the placement was guest content, a contextual edit or campaign-led coverage.
Monthly and quarterly roll-ups help finance reconcile credit usage against page-priority shifts without manual merges. Agencies toggle unbranded export layouts for client decks while internal views retain full operational detail including credit mechanics. Historical placements remain accessible for the life of the workspace under your agreement; removed or replaced links stay in history with status notes rather than disappearing silently.
Core metrics on every row
- Live URL and referring domain
- Anchor text and link attribute
- Target page on your site and placement type
- Indexation status where checks apply
- Approval and publish timestamps for audit trails
Exports and review cadence
Schedule exports around how your leadership already runs monthly or quarterly business reviews.
CSV and PDF exports
Filter by workspace or campaign tag, then export unbranded PDFs for client meetings or CSVs for finance models.
Optional traffic overlays
When integrations are connected, referral and landing-page columns appear beside link rows for the same date range.
Monthly operational review
Most teams review new live links alongside credit usage and upcoming priorities from the approval queue.
Quarterly portfolio roll-up
Leadership views aggregate referring domain mix and target-page coverage without exporting to spreadsheets first.
Who benefits: in-house teams vs agencies
In-house teams give finance and product marketing a read-only reporting login so SEO is not the sole translator of delivery progress. Stakeholders see which priority pages received placements in period and whether replacements processed under agreed rules. Because reporting ties to approval records, internal audits answer who signed off before publish without email archaeology.
Agencies export unbranded summaries per client workspace while retaining portfolio roll-ups internally. Account leads present live URL lists under their brand without exposing consolidated publisher sourcing. Margin conversations stay in internal views with credit detail; client-facing PDFs focus on outcomes and timelines instead.
Reporting across placement formats
Guest contributions, niche edits and digital PR pickups label placement type on each row so mixed programs roll up cleanly. Indexation checks apply to host pages for edits as well as new articles. When a live link fails agreed verification within the replacement window in your proposal, status notes appear on the same row rather than in a separate log.
Portfolio views aggregate referring domain diversity and target-page coverage when you run multiple workspaces or domain groups under one master agreement. That roll-up helps enterprise SEO leaders compare business units without merging CSVs manually, while each unit retains its own approval history and blocklist settings underneath.
Related platform features
Reporting is the final step in how delivery works after marketplace browsing, approvals and order tracking. Quality standards explain the vetting bands attached to publisher rows in exports. Connect integrations to reduce manual merges with analytics, or book a demo to see sample exports for your vertical. Browse case study metrics for examples of how teams present non-brand session trends beside placement lists in reviews.
Frequently asked questions
Practical answers for teams evaluating this part of the product.
Which metrics appear in the reporting dashboard?
Live URLs, anchors, referring domains, placement type, indexation status and optional connections to analytics properties you authorize. Rank and referral traffic views depend on integrations you enable. Everything ties back to the approval record for auditability.
Can reports be exported for leadership or clients?
CSV and PDF exports summarize placements over a chosen date range with unbranded layouts for agency client decks. Filters limit exports to a workspace, domain group or campaign tag. Exports inherit the same metrics visible in the dashboard—nothing hidden behind a separate upsell.
How do analytics integrations affect reporting?
When you connect Search Console or an analytics property, referral and landing-page signals can sit beside placement data. Connections are read-only and scoped to properties you approve. Disconnected integrations fall back to link-level reporting without breaking historical records.
How often should we review reporting?
Most teams review monthly alongside credit usage and page-priority shifts. Quarterly roll-ups help finance reconcile spend against pipeline pages. The dashboard supports both views without manual spreadsheet merges.
Do agency workspaces get unbranded reporting?
Agency plans include client-facing exports without our logo so you present progress under your brand. Internal views retain full operational detail. White label settings apply per workspace, not globally across your organization.
How long is reporting history retained?
Completed placements remain accessible for the life of the workspace under your agreement. Removed or replaced links stay in history with status notes rather than disappearing silently. Long-term retention supports profile audits and renewal conversations.
See this workflow in a live demo
Walk the dashboard with an operator and decide whether the process fits your team.